Macroeconomics & Crypto
FOMC Meetings and Crypto: Why the Fed Matters More Than Ever
On March 18, 2025, the Federal Open Market Committee opted to maintain interest rates at 4.50-4.75%, but hawkish tones in the dot plot projections led to a 4% Bitcoin drop to $110,500, with Ethereum experiencing a 7% decline before partial recovery on revised expectations. This event illustrated how a group of policymakers in Washington can jolt the decentralized world of cryptocurrencies. Traders often ask why a traditional Fed meeting holds such sway over Bitcoin and altcoins. In this detailed exploration, we'll break down the basics for newcomers, trace historical patterns, analyze data, and share strategies to navigate these high-stakes events.
Demystifying the FOMC: Essential Concepts Explained
To fully appreciate the FOMC's impact on crypto, foundational knowledge proves essential. Explanations here start with straightforward analogies for beginners, progressing to nuanced economic principles for advanced readers. All concepts tie directly to the FOMC's operations and decisions.
What is the Federal Reserve and the FOMC?
The Federal Reserve serves as the central banking system of the United States, established in 1913 to stabilize the financial system after recurring panics. It operates independently but under congressional oversight. The FOMC, or Federal Open Market Committee, forms the heart of the Fed's monetary policy arm. This committee comprises 12 voting members: seven governors appointed by the President and confirmed by the Senate, the New York Fed president as a permanent voter, and four rotating presidents from the remaining 11 regional Fed banks. The FOMC convenes eight times yearly to assess economic conditions and adjust policies, with 2025 meetings occurring on January 28-29, March 18-19, April 29-30, June 17-18, July 29-30, September 16-17, October 28-29, and December 16-17.
For novices, picture the FOMC as a team of experts fine-tuning the nation's economic engine. For experts, recognize its role in implementing dual mandates of maximum employment and price stability through tools like open market operations, which involve buying or selling government securities to influence money supply.
What Are Interest Rates as Set by the FOMC?
Interest rates represent the cost of borrowing money, but in the FOMC context, they center on the federal funds rate—the overnight lending rate between banks. The FOMC establishes a target range for this rate, such as the 4.25% to 4.50% held in July 2025.
For beginners, think of this rate as the base price for short-term loans in the banking system, like setting the wholesale cost that affects retail prices everywhere. The FOMC adjusts this range during meetings, using open market operations to buy or sell Treasury securities, thereby injecting or withdrawing reserves to guide the effective federal funds rate within the target.
For intermediate learners, understand that this rate cascades to other benchmarks: prime rates for consumer loans, LIBOR or SOFR for international dealings, and Treasury yields. Advanced audiences note the FOMC's influence via forward guidance, where statements shape market expectations, altering the yield curve. Mathematically, the federal funds rate impacts discounting in valuation models, such as the Gordon Growth Model for equities (P = D / (r - g), where r includes risk-free rates tied to FOMC policy), extending to crypto pricing through opportunity cost comparisons.
What Do Interest Rates Do Under FOMC Guidance?
FOMC-set interest rates regulate economic pace. Simply put, higher rates act like brakes on a speeding car, slowing spending to curb inflation; lower rates accelerate like pressing the gas, encouraging growth. In July 2025, the FOMC maintained rates at 4.25-4.50% to balance inflation risks with employment goals, as minutes revealed almost all participants favored the hold while some advocated cuts.
For beginners, higher FOMC rates make loans costlier, so people buy fewer homes or cars, businesses hire less, and the economy cools. Lower rates cheapen borrowing, sparking purchases and investments. Intermediate explanations highlight transmission channels: consumption (via disposable income after debt payments), investment (net present value of projects rises with lower discount rates), and net exports (higher rates strengthen the dollar, making U.S. goods pricier abroad).
Advanced details involve macroeconomic models. The FOMC targets the neutral rate (r*), estimated via Laubach-Williams or Holston-Laubach-Williams models, balancing growth without inflation. Adjustments follow the Taylor Rule: i = r* + π + 0.5(π - π*) + 0.5(y - y*), where i is the nominal rate, π inflation, π* target (2%), y output, y* potential. Effects include Phillips Curve trade-offs (inflation vs. unemployment) and potential hysteresis if rates stay misaligned. Globally, FOMC hikes can trigger capital outflows from emerging markets, amplifying volatility in assets like crypto through risk aversion.
How Do FOMC Interest Rates Affect Everyone?
FOMC decisions ripple through daily lives. For the uninitiated, higher rates mean pricier mortgages—perhaps adding hundreds to monthly payments—or tougher credit card balances. Businesses might delay expansions, leading to fewer jobs. Lower rates ease these burdens, boosting home sales and stock portfolios. Intermediate views see sectoral impacts: real estate thrives on cuts, while banks' net interest margins widen on hikes.
For experts, quantify via multipliers: a 1% rate cut might boost GDP 0.5-1% over quarters, per DSGE models like FRB/US. Distributional effects matter—debtors gain from cuts, savers from hikes—potentially widening inequality. In crypto, higher rates increase opportunity costs, diverting funds to yields, as seen in 2022's bear market.
What Are FOMC Minutes?
Minutes provide a detailed record of FOMC deliberations, released three weeks post-meeting, like August 20, 2025, for July.
Beginners see them as meeting notes revealing why rates stayed put. Intermediate users parse for hints on future moves, like hawkish concerns on inflation. Experts analyze for voting patterns and alternative scenarios, using natural language processing to gauge sentiment shifts impacting forward rates.
Other Key FOMC Concepts
Dot Plot: A quarterly chart (March, June, September, December) plotting anonymous FOMC projections for future federal funds rates. Simply, it maps expected rate paths, like dots clustering lower for cuts. Deeper, it reflects median forecasts, influencing term premia and options pricing via implied volatility.
Quantitative Easing (QE): FOMC buys assets to lower long-term rates when short-term ones near zero. Basic: Pumps money into economy. Advanced: Expands balance sheet, compressing spreads via portfolio rebalancing, as in 2020's $3 trillion surge.
Quantitative Tightening (QT): FOMC reduces holdings, raising rates. Elementary: Drains liquidity. Sophisticated: Caps roll-offs (e.g., $95 billion/month), affecting reserve scarcity and repo markets.
Hawkish vs. Dovish: Hawkish FOMC stances prioritize inflation control via hikes; dovish emphasize growth via cuts. Basic analogy: Hawks hunt inflation, doves nurture jobs. Expert: Measured by dissent in minutes or speech tone, influencing Fed funds futures.
Press Conference: Post-meeting Q&A by the Chair. Straightforward: Explains decisions. Nuanced: Real-time market mover, as Powell's August 23, 2025, Jackson Hole remarks sparked crypto rallies.
Economic Projections: Quarterly summaries of GDP, unemployment, inflation forecasts. Simple: Future economy outlook. Complex: Incorporate uncertainty bands, guiding policy via fan charts.
These elements equip readers to track how FOMC actions intersect with crypto dynamics.
Historical Background: Crypto's Growing Ties to FOMC Policies
Cryptocurrencies once operated in isolation from FOMC decisions. Bitcoin's 2009 launch critiqued central banking, and early price swings stemmed from adoption and events like halvings. The 2020 pandemic marked a turning point, as FOMC's near-zero rates and QE propelled Bitcoin from $5,000 to $69,000 by 2021.
Inflation's 2022 peak prompted FOMC hikes to 5.25%, cratering Bitcoin to $15,000 amid risk-asset sell-offs.
By 2024-2025, ETF inflows tied crypto closer, with July 2025's rate hold and Jackson Hole signals driving surges to $116,000.
This maturation reflects institutional integration, making FOMC pivotal.
Core Analysis: FOMC's Volatility Effects on Crypto
FOMC events serve as catalysts for cryptocurrency price movements, often amplifying market turbulence through shifts in liquidity and investor sentiment. Data from multiple sources illustrates how these meetings influence volatility, with Bitcoin and altcoins experiencing heightened swings on announcement days. Volatility on FOMC days can average 1.5 to 2.5 times the norm, driven by rapid reactions to policy signals.
This section delves into the structure of these events, key metrics and mechanisms, and illustrative case studies to provide a layered understanding.
Structure of FOMC Events
FOMC meetings follow a predictable yet high-stakes format that traders monitor closely. Each two-day session culminates in an announcement at 2:00 PM ET on the second day, releasing the rate decision, policy statement, and, quarterly, the dot plot and economic projections. The statement is scrutinized for subtle language changes—phrases like "inflation risks remain elevated" can signal hawkishness, prompting immediate sell-offs, while "progress toward 2% inflation" might indicate dovishness, sparking rallies.
Following the release, the Fed Chair's press conference at 2:30 PM ET often becomes the main event, with Q&A sessions revealing nuances not in the statement. For instance, Powell's responses can clarify forward guidance, influencing market expectations for future meetings. Three weeks later, minutes offer deeper insights into internal debates, sometimes causing aftershocks if they reveal unexpected divisions. In July 2025, the minutes released on August 20 showed near-unanimous support for holding rates but with some members pushing for cuts, leading to a modest Bitcoin rebound as markets interpreted it as a step toward easing.
Traders use this timeline to position: pre-announcement de-risking reduces exposure, while post-conference momentum trades capture the "actual move" after initial fakes.
Metrics and Mechanisms
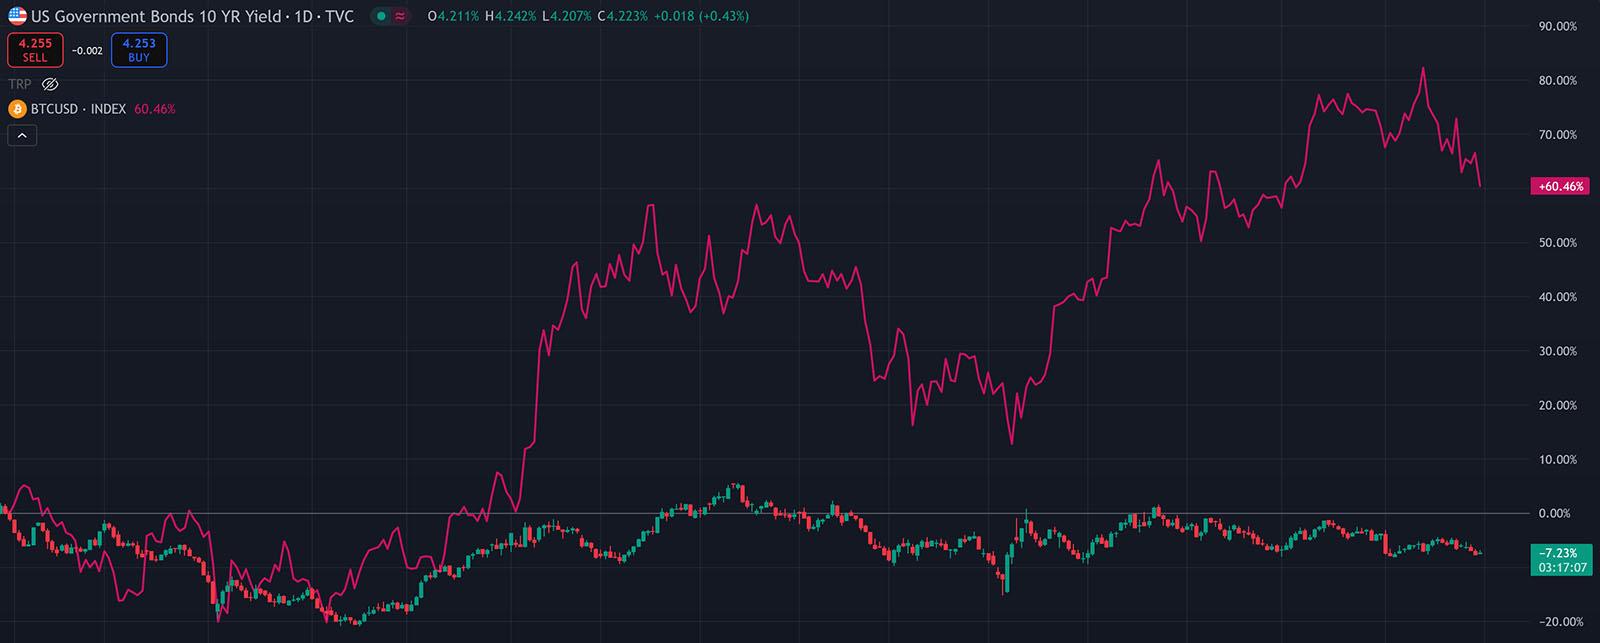
Quantitative metrics highlight FOMC's impact on crypto. Bitcoin's 30-day rolling correlation with the federal funds rate often ranges from -0.4 to -0.6 during tightening cycles, indicating an inverse relationship where rate hikes correlate with price declines.
In 2024-2025, this tightened to -0.5 amid steady rates, per chart analyses showing Bitcoin drops when rates hold higher than expected.
Volatility metrics show intraday ranges expanding 2-3 times, with implied volatility for Bitcoin options spiking 20-30% pre-event.
Mechanisms include liquidity channels: Higher rates increase borrowing costs, diverting capital to yield-bearing assets like Treasuries, reducing crypto inflows. A 1% rate cut could correlate with 13-21% Bitcoin gains, as estimated in studies.
Algorithmic trading exacerbates this, with high-frequency strategies reacting in milliseconds to headlines, widening spreads and fueling liquidations—over $500 million in some 2025 events.
Sentiment mechanisms tie in: Dovish signals boost risk appetite, lifting altcoins like Ethereum (beta ~1.5 to Bitcoin), while hawkish tones trigger risk-off modes. Comparing periods, 2022's hike cycle saw correlations peak at -0.65, explaining 50% drops; 2025's steady rates yield looser -0.45, but events like minutes tighten it temporarily.
Case Studies
Examining specific FOMC instances reveals patterns in crypto reactions.
March 2022: The first rate hike (0.25%) amid inflation peaks signaled tightening, dropping Bitcoin 5% intraday as markets anticipated further increases. Ethereum fell 7%, with liquidations exceeding $300 million, highlighting altcoin amplification.
Duration: Initial spike reversed partially over days, but set bear tone.
November 2024: A rate hold with dovish projections (dot plot showing cuts) rallied Bitcoin 7% to $85,000, as easing expectations boosted liquidity inflows. Solana surged 10%, driven by risk-on sentiment.
July 2025: Rates held at 4.25-4.50%; Bitcoin dipped 2.5% to $117,681 before recovering on cut hints in Powell's conference. Ethereum gained 12% over the week, fueled by ETF inflows amid cooling inflation data.
Minutes on August 20 added nuance, with some cut advocacy sparking further upside.
August 2025 Jackson Hole (FOMC-related): Powell's dovish speech on rate cuts propelled Bitcoin 5% to $116,000, with $500 million liquidations cleared. Altcoins like XRP rose 8%, showing asymmetry in dovish responses.
These cases demonstrate magnitude (2-12% moves), duration (hours to weeks), and causation (policy surprises vs. expectations).See: https://clometrix.com/data?event=fomc-meeting
Counterpoints and Exceptions: Limits to FOMC Dominance
While FOMC wields significant influence, counterexamples reveal its boundaries. Crypto-specific catalysts can overshadow, as in January 2024 ETF approvals, which rallied Bitcoin 15% despite a hawkish hold, decoupling from rate fears.
Expected outcomes, like April 2025's no-surprise hold, often yield muted <2% moves, with volatility below average.
Media biases contribute: Crypto outlets frame hawkish minutes as "transitory," downplaying downside, while traditional finance amplifies risks, skewing perceptions.
Optimistic decoupling signs emerge—Bitcoin's S&P correlation dipped below 0.5 in non-event 2025 periods, per analytics, as on-chain utility grows.
Stablecoins and DeFi resilience during QT phases further limit impacts, with studies showing heterogeneous responses across blockchain layers.
Geopolitical or regulatory events, like 2025's stablecoin acts, can dominate, reminding that FOMC's grip, while firm, isn't absolute.
Future Outlook: FOMC and Crypto Horizons
Looking to late 2025-2026, FOMC trajectories could reshape crypto landscapes. With September 2025 cut odds at 80-100%, Bitcoin might surge 13-21% per 1% reduction, potentially hitting $130,000-200,000 by year-end if three cuts materialize.
Ethereum could eye $5,000, amplified by ETF flows.
Conditions for this: Sustained inflation near 2%, strong employment avoiding recession signals.
Conversely, persistent 3%+ inflation might limit cuts to one, capping Bitcoin at $120,000 amid QT continuation.
Metrics for success: On-chain volumes stable post-FOMC (signaling decoupling), correlations below 0.3. Speculatively, 2026's neutral rate normalization could extend bulls if adoption shifts to utility, but hawkish pivots risk volatility at 50-60% annualized. Patterns suggest exciting resilience as macro eases.
Trader Strategies: Leveraging FOMC Insights
Navigating FOMC requires disciplined tactics, blending preparation and execution. Pre-event: Reduce leverage to avoid whipsaws, as advised in trader discussions—close positions 10-30 minutes before announcements.
Post-release: Wait 5-15 minutes for initial fakes, then trade momentum with tight 1-2% stops; scalpers target 2-4% on dovish surprises.
Styles vary: Day traders scalp volatility, entering longs on cut hints for quick gains; swing traders fade extremes, buying dips after hawkish overreactions.
Hedging uses options straddles for bidirectional capture. Backtest against historicals: 92% accuracy in some strategies fading initial moves.
Clometrix enhances with playbooks on median moves (e.g., 3% Bitcoin upside on cuts), interactive charts visualizing correlations, and 40,000+ analyses for free-tier backtesting—aligning macro signals with on-chain for precise entries.
Conclusion
FOMC's stewardship of rates and policy profoundly shapes crypto volatility, from foundational mechanics like federal funds targets to data showing 2-5% swings and inverse correlations. Historical patterns, expanded through case studies and metrics, empower anticipation, while exceptions and outlooks offer balanced realism.
Traders equipped with these insights, via tools like Clometrix's playbooks and visualizations, can navigate dynamics effectively. This is analysis, not advice—do your own research!
13th August 2025
Read More
 Stablecoins like USDT and USDC hold short-term T-bills (maturities of 3-12 months) as primary reserves due to their liquidity and low risk. In 2025, 3-month T-bill yields average 4.2%, up from 3.5% in 2024, reflecting Fed policy to curb inflation near 3%.
Higher yields incentivize issuers to lock in returns, stabilizing reserves but tightening crypto liquidity as capital shifts from trading to yield-bearing assets.
Stablecoins like USDT and USDC hold short-term T-bills (maturities of 3-12 months) as primary reserves due to their liquidity and low risk. In 2025, 3-month T-bill yields average 4.2%, up from 3.5% in 2024, reflecting Fed policy to curb inflation near 3%.
Higher yields incentivize issuers to lock in returns, stabilizing reserves but tightening crypto liquidity as capital shifts from trading to yield-bearing assets.