
In the volatile universe of cryptocurrency, few debates stir as much passion as the question of whether Bitcoin can ever truly sever its ties to the traditional stock market. Born from Satoshi Nakamoto's whitepaper in the aftermath of the 2008 financial crisis, Bitcoin was envisioned as a revolutionary asset. It was designed to be decentralized, borderless, and impervious to the manipulations of central banks, Wall Street speculators, and economic downturns. Often dubbed "digital gold," it promised to serve as a safe haven, a hedge against inflation and systemic failures that plague fiat currencies and equities. Yet, more than a decade later, BTC's price movements frequently mirror those of the S&P 500, the benchmark index for U.S. stocks. This persistent correlation raises profound questions about Bitcoin's identity. Is it evolving into a mature, independent asset class, or has it become just another high-risk play in the global financial casino? To answer this, we need to dissect the data, trace the historical shifts, and explore the forces pulling these markets together or potentially apart. We'll examine historical trends, key drivers of synchronization, rare instances of divergence, and the conditions required for genuine independence, drawing on metrics from reliable sources like CoinMetrics, Glassnode, and TradingView to provide a comprehensive view.
A Promise of Independence
Bitcoin's origin story is one of rebellion. Launched in 2009 amid widespread distrust of traditional finance, it was designed to operate outside the established system. Early adopters championed it as an alternative to stocks, bonds, and commodities, free from the influences of corporate earnings reports, interest rate hikes, or geopolitical tensions that roil Wall Street. In those nascent years, BTC's price was largely dictated by internal crypto dynamics. These included the quadrennial halving events that reduce mining rewards and constrict supply, regulatory crackdowns in major economies like China, or high-profile hacks on exchanges such as Mt. Gox. These factors created wild volatility, but it was volatility unique to crypto, untethered from the broader economy.
The allure was clear. During times of stock market turmoil, Bitcoin could theoretically attract capital fleeing equities, acting as a counterbalance in diversified portfolios. This narrative gained traction during events like the 2013 Cyprus banking crisis, where BTC surged as locals sought alternatives to frozen bank accounts. Analysts and enthusiasts alike painted a picture of decoupling. This future would see Bitcoin's value determined by its own merits, such as scarcity with a capped supply of 21 million coins, utility in peer-to-peer transactions, and growing acceptance as a store of value. For instance, in 2017's bull run, BTC's price exploded to nearly $20,000 driven by retail frenzy and ICO hype, while the S&P 500 chugged along steadily on corporate profits. Such periods reinforced the idea that Bitcoin could thrive independently, insulated from the cyclical nature of traditional markets. However, as adoption grew and more sophisticated players entered the scene, these early promises began to encounter real-world challenges, leading to an unexpected convergence with equities.
The Rise of Correlation
 The turning point came with the COVID-19 pandemic in 2020, a black swan event that reshaped global markets. As governments and central banks unleashed unprecedented stimulus with trillions in quantitative easing and fiscal packages, risk assets exploded. The S&P 500, buoyed by tech giants like Apple and Amazon, climbed to new heights amid remote work booms and e-commerce surges. Bitcoin, too, rode the wave, skyrocketing from under $5,000 in March 2020 to over $60,000 by April 2021. This wasn't coincidence. It was synchronization, fueled by cheap money and investor risk appetite.
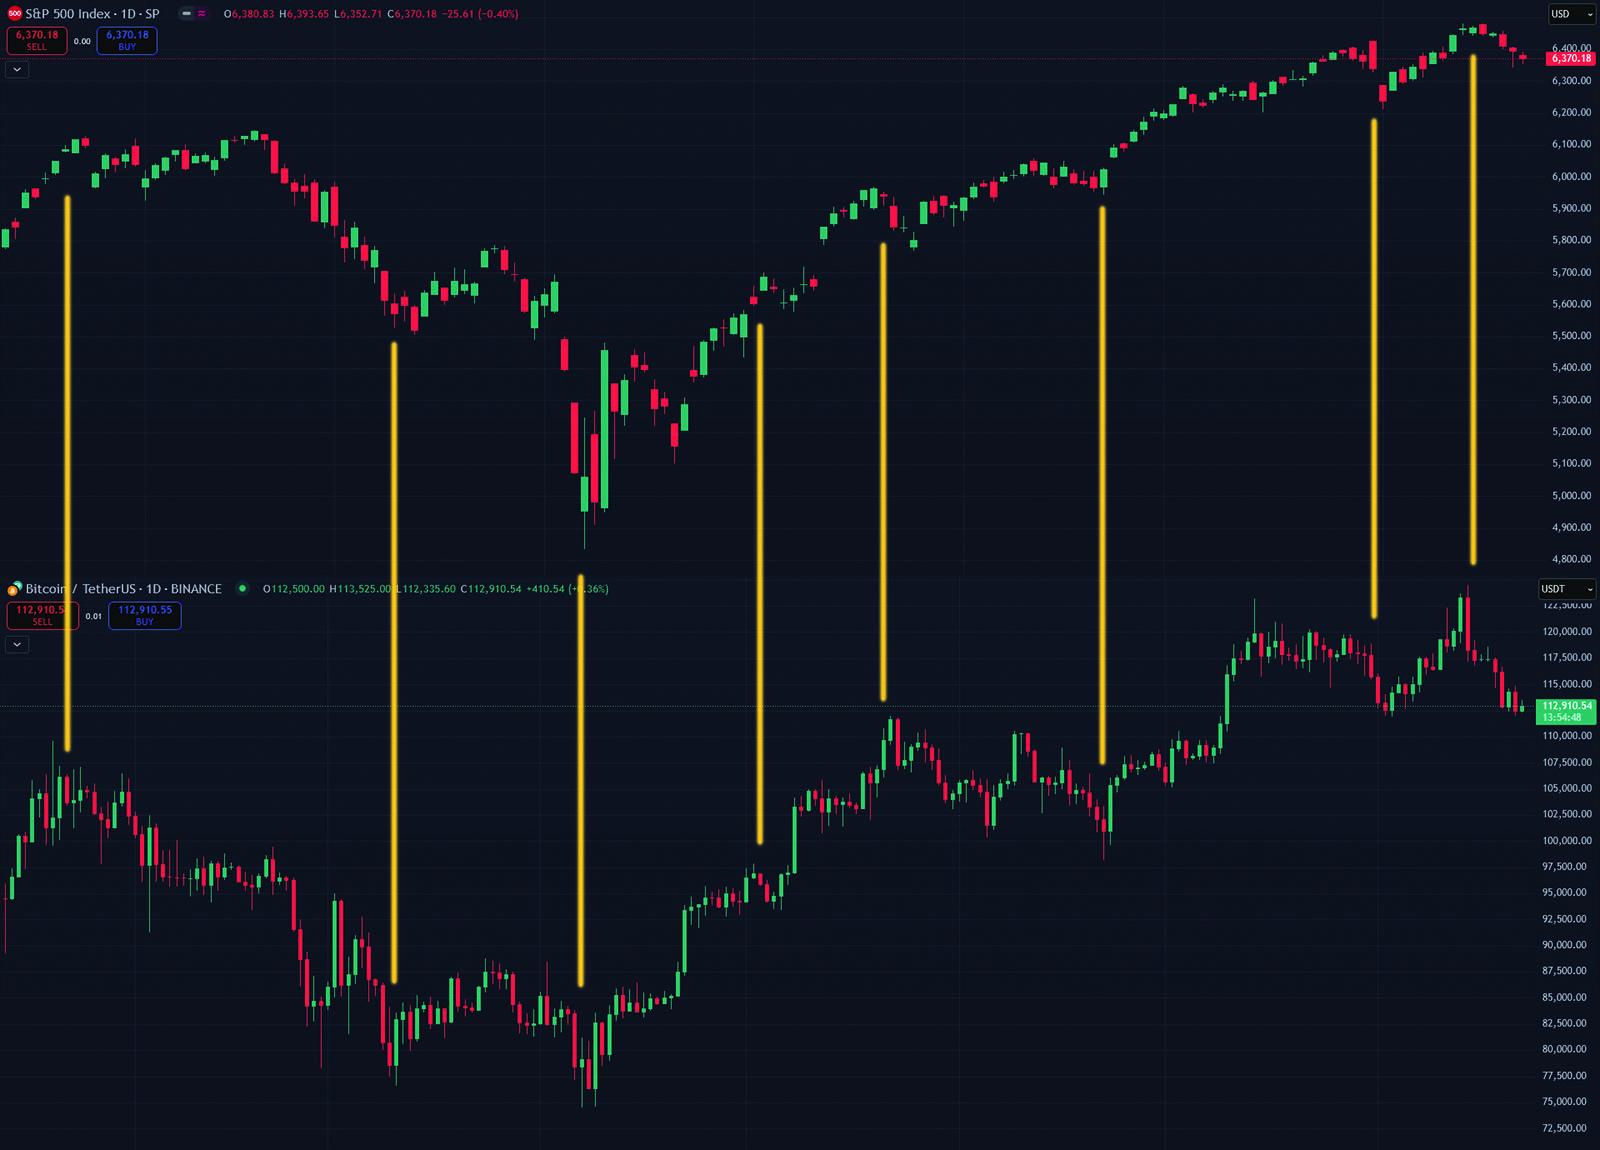
Data from sources like CoinMetrics and TradingView illustrates the shift starkly. Pre-2020, the 90-day rolling correlation between BTC and the S&P 500 hovered around 0.2 to 0.3 on a scale where 1 means perfect alignment and -1 means opposite movement. Post-pandemic, that figure spiked to 0.8 or higher during peak periods, meaning Bitcoin was moving in lockstep with stocks more often than not. When equities faltered, such as during the 2022 bear market triggered by inflation fears and rising interest rates, Bitcoin didn't just dip. It plummeted harder, losing over 70% of its value while the S&P 500 shed about 20%. This behavior shattered the hedge narrative, positioning BTC not as a protector but as an amplifier of market risks, akin to a leveraged bet on tech stocks.
To quantify this further, consider rolling correlation coefficients over longer horizons. From 2015 to 2019, the average correlation was approximately 0.15, reflecting Bitcoin's isolation in a niche ecosystem. By contrast, from 2021 to 2024, it averaged 0.65, with peaks reaching 0.9 during major sell-offs like the Luna collapse or FTX scandal, which rippled through both crypto and broader risk assets. These numbers highlight how external economic forces have increasingly dictated Bitcoin's path, turning it from a fringe experiment into a correlated component of the global financial landscape.
Why the Link Exists
At its core, this correlation stems from shared investor psychology and structural overlaps. Bitcoin, despite its decentralized ethos, is increasingly treated as a "risk-on" asset. This means something you buy when optimism reigns and sell when fear grips the market. Institutional players, who now dominate trading volumes, allocate capital across portfolios that include both equities and crypto. When liquidity tightens, say due to Fed rate hikes, fund managers reduce exposure to all volatile holdings, creating a domino effect. The S&P 500, with its $40 trillion market cap, sets the tone. Crypto, at around $2 trillion, follows suit.
Liquidity dynamics exacerbate this. Traditional markets offer deep pools of capital through mechanisms like margin lending and derivatives, which crypto has only begun to replicate. During bull runs, easy money flows into both. In downturns, forced liquidations cascade across exchanges. Moreover, macro traders, armed with algorithms that scan for correlations, bet on BTC based on S&P 500 signals. For instance, a hotter-than-expected CPI report might tank stocks and BTC alike, as it signals prolonged high rates. Historical examples abound: The March 2020 crash saw BTC drop 50% in a day alongside the S&P 500's plunge, driven by global lockdown fears.
Regulatory convergence adds another layer. As governments worldwide impose stricter oversight on crypto, such as the SEC's crackdown on unregistered securities, Bitcoin's fate ties closer to broader financial regulations affecting stocks. Environmental concerns over mining energy use have also linked BTC to ESG trends influencing equities. In essence, the link isn't accidental. It's a byproduct of Bitcoin's mainstreaming, where its appeal as an alternative asset ironically pulls it deeper into the system it sought to escape. This integration has benefits, like increased legitimacy and liquidity, but it comes at the cost of independence, making BTC vulnerable to the same boom-bust cycles that define stock markets.
Glimpses of Independence
Yet, the story isn't one of total surrender. There are flashes where Bitcoin bucks the trend, hinting at its potential for decoupling. During the 2023 regional banking crisis in the U.S., sparked by the collapse of Silicon Valley Bank, the S&P 500 wobbled amid fears of contagion. Bitcoin, however, rallied, drawing inflows from investors viewing it as a hedge against banking fragility. Similarly, in regions like Argentina or Turkey, where hyperinflation erodes local currencies, BTC serves as a practical store of value, its price movements decoupled from U.S. stock sentiment.
On-chain metrics provide further encouragement. Data from Glassnode reveals a growing cohort of long-term holders, often called "diamond hands," who control over 75% of BTC supply and rarely sell during short-term dips. This reduces liquidity available for panic selling, allowing Bitcoin to weather panic storms better in certain windows. Geopolitical tensions, such as the Russia-Ukraine conflict, have also seen BTC inflows as a portable, censor-resistant asset, diverging from stock market reactions tied to energy prices or supply chains. For example, in 2022, while the S&P 500 fell on rising oil costs, BTC stabilized as a tool for cross-border aid in war zones.
These instances underscore Bitcoin's unique attributes. They include its fixed supply, global accessibility, and resistance to seizure. In emerging markets, where stock exchanges are volatile or inaccessible, crypto adoption for remittances or savings creates demand uncorrelated with Wall Street. If these trends expand, driven by advancements like the Lightning Network for faster transactions or broader ETF approvals, they could foster sustained independence. Expanding on this, consider adoption statistics: Chainalysis reports that in 2023, crypto transaction volumes in Latin America and Africa grew by 40%, often decoupled from U.S. equity trends, as users turned to BTC for stability amid local currency devaluation.
What True Decoupling Would Look Like
True decoupling wouldn't mean Bitcoin ignores the world economy entirely. Rather, it would consistently behave counter-cyclically to equities, attracting capital during stock market weakness and providing genuine diversification. Imagine a scenario where an S&P 500 plunge from rising rates draws funds into BTC as a deflationary asset, much like gold during recessions. For this to happen, Bitcoin must transcend speculation and embed itself in real-world utility. This includes widespread merchant acceptance, integration into payment systems, and regulatory clarity that treats it as a distinct commodity.
Broader adoption is key. If more nations follow El Salvador's lead in holding BTC reserves, or if DeFi platforms mature to rival traditional banking, crypto's ecosystem could generate internal demand strong enough to overshadow stock market influences. Metrics like a sustained correlation below 0.3, coupled with BTC outperforming during equity downturns, would signal success. Until then, the S&P 500 remains a reliable barometer for BTC's short-term trajectory, guiding traders through the noise of macro events. To illustrate, historical gold correlations with stocks average around 0.1 during crises, a benchmark BTC could aim for. Achieving this might require years of infrastructure development, such as scalable layer-2 solutions and clearer tax frameworks, to shift from speculative trading to everyday economic use.
Final Thoughts
The dream of Bitcoin decoupling from stocks endures, but reality paints a picture of intertwined fates. For now, BTC mirrors the S&P 500's rhythms, surging on economic optimism and crashing amid fears, making it a volatile companion rather than a steadfast alternative. Traders ignoring this link do so at their peril. Understanding correlations can sharpen strategies, whether hedging portfolios or timing entries.
Yet, hope lingers. As Bitcoin evolves, bolstered by technological upgrades, institutional maturation, and global adoption, it may yet fulfill its "digital gold" promise, breaking free from Wall Street's shadow. The path forward isn't linear, but in a world of economic uncertainty, Bitcoin's potential to redefine independence keeps the conversation alive. For investors, the key is vigilance. Watch the data, question the narratives, and remember that in finance, as in life, true freedom is earned, not granted. With ongoing developments like spot Bitcoin ETFs drawing billions in inflows and blockchain innovations enhancing usability, the decoupling debate is far from settled, promising exciting chapters ahead in the crypto saga.